Visualizing Digital Health: A Guide to Telemedicine Services Types Infographics and Workflow Design
The rapid expansion of virtual healthcare has created a significant communication gap between medical providers, technology developers, and patients. While the clinical efficacy of remote care is well-documented, explaining the operational mechanics often proves challenging. This is where strategic visual communication becomes essential. Utilizing a comprehensive Telemedicine Services Types Infographic allows organizations to translate complex digital health ecosystems into digestible, actionable insights. Whether for an online hospital presentation, investor pitch, or patient education portal, the ability to visualize service modalities determines how effectively stakeholders understand the value proposition of telehealth.
Categorizing Care Modalities Through Vector Graphics
Telemedicine is not a monolith; it comprises distinct service categories that require specific technological infrastructures and clinical protocols. When designing educational materials, accuracy in classification is paramount. High-quality vector infographic templates facilitate this precision by offering modular components that can be customized to reflect specific organizational offerings. Unlike raster images, vectors maintain crisp edges at any scale, making them ideal for both large-format conference displays and mobile-responsive web content.
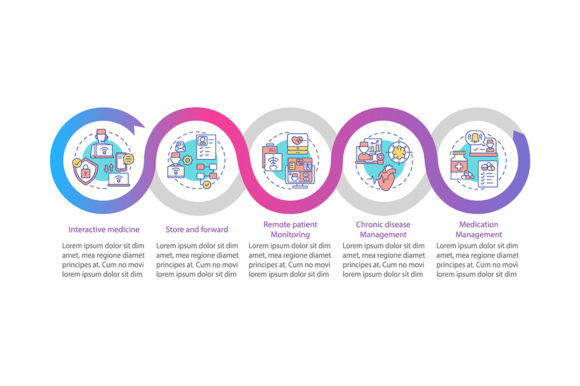
The primary categories typically visualized include synchronous video consultations, asynchronous store-and-forward exchanges, remote patient monitoring (RPM), and mobile health integration. Each category demands unique iconography and color coding to differentiate its function. For instance, synchronous care is often represented by real-time communication symbols like cameras or chat bubbles, emphasizing immediacy. In contrast, RPM visuals frequently utilize data streams, wearable device icons, and trend lines to convey continuous observation. By leveraging editable AI or EPS files, designers can adjust these metaphors to align with brand identity while maintaining clinical accuracy. This flexibility ensures that the visual representation matches the actual scope of services provided, preventing misinformation and managing user expectations effectively.
The Strategic Value of Editable Source Files
Professionals creating healthcare content understand that regulatory landscapes and service offerings evolve rapidly. Relying on static imagery creates long-term maintenance issues. Access to source files such as SVG, AI, and EPS within a design asset package transforms a one-time graphic into a living document. Scalable Vector Graphics (SVG) are particularly critical for modern web accessibility and performance. They allow search engines to index graphical content and enable screen readers to interpret visual data, thereby improving SEO and inclusivity.
Furthermore, having layered source files enables granular control over information density. A researcher might need a dense, technical diagram showing API integrations between electronic health records and telemedicine platforms, while a consumer-facing brochure requires a simplified version focusing solely on patient benefits. With a single master template, creators can toggle layer visibility to generate multiple variations without rebuilding the design from scratch. This efficiency is vital for marketing teams and educators who must produce consistent yet tailored content across diverse channels.
Structuring Data Visualization with Five-Step Frameworks
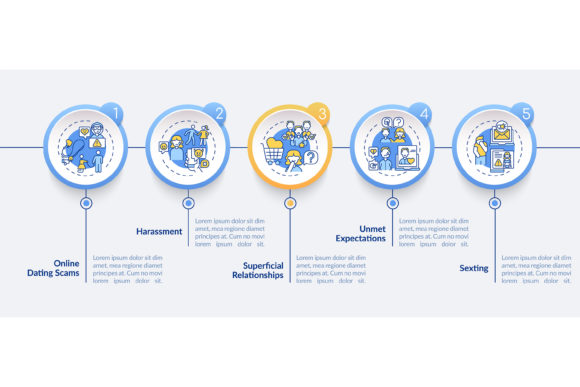
Explaining the patient journey or the implementation of a new telehealth platform requires more than static categorization; it demands narrative flow. A five-step data visualization framework provides the cognitive scaffolding necessary for audiences to process sequential information. In the context of telemedicine, this structure often maps to the standard care cycle: Intake, Triage, Consultation, Treatment/Prescription, and Follow-up/Monitoring.
This quintessential structure aligns with human working memory capacity, making it easier for viewers to retain complex procedural information. When applied to an online hospital presentation, each step serves as an anchor point for deeper discussion. For example, the "Triage" step can visually distinguish between automated algorithmic sorting and nurse-led assessment, clarifying resource allocation. The "Follow-up" step can illustrate the feedback loop between home monitoring devices and provider dashboards. By strictly adhering to a five-step limit, designers avoid clutter and force prioritization of the most critical workflow elements. This constraint fosters clarity and ensures that the audience grasps the end-to-end experience rather than getting lost in peripheral details.
Linear Icons and Cognitive Load Reduction
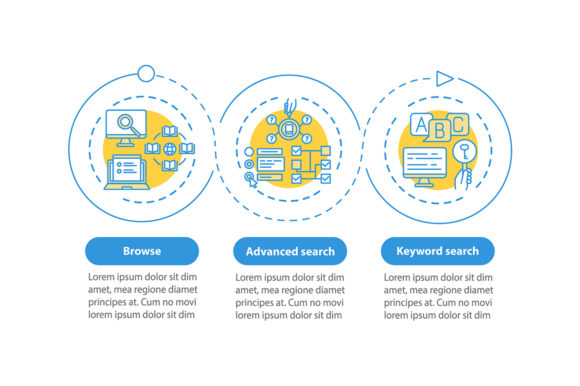
The aesthetic choice of iconography directly impacts comprehension speed. Linear icons, characterized by clean outlines and minimal fill, have become the industry standard for healthcare interfaces and infographics. Their utility extends beyond mere style; they serve a functional purpose in reducing cognitive load. Filled, heavy icons can create visual noise when arranged in a timeline or grid, competing with accompanying text for attention. Linear icons recede slightly, allowing typography and data points to take precedence.
In a workflow layout, linear icons act as efficient signposts. They guide the eye along the process timeline without interrupting the reading flow. Consistency in stroke weight and corner radius across all icons establishes a visual rhythm that reinforces professionalism and trustworthiness—critical attributes in medical contexts. When selecting a template, verifying that the linear icon set is comprehensive and stylistically uniform saves countless hours of adjustment. A cohesive icon system signals that the underlying telemedicine service is equally organized and reliable.
Process Timeline Charts for Operational Transparency
Stakeholders ranging from hospital administrators to software developers need to understand the temporal dynamics of telemedicine. Process timeline charts differ from circular lifecycle diagrams by emphasizing progression, duration, and dependencies. These visualizations are instrumental in identifying bottlenecks and setting realistic service level agreements. For business owners and researchers, a timeline chart derived from a robust vector template can illustrate the latency between data capture and clinical intervention in RPM scenarios, or the average turnaround time for asynchronous dermatology reviews.
Effective timeline designs incorporate variable spacing to represent relative time investment. A five-minute intake form should not occupy the same visual real estate as a thirty-minute video consultation. Smart templates allow for this proportional representation, transforming abstract schedules into intuitive spatial relationships. Additionally, integrating status indicators or decision nodes within the timeline helps visualize conditional logic, such as what happens when a patient’s vitals trigger an alert versus when they remain stable. This level of operational transparency builds confidence among investors and partners who evaluate the scalability and efficiency of the telemedicine model.
Adapting Visual Assets for Diverse Audiences
The versatility of a comprehensive design package lies in its adaptability across different user segments. Educators training the next generation of healthcare professionals require detailed anatomical and technological overlays that explain how remote diagnostics work. Conversely, hobbyists and independent practitioners setting up small-scale telehealth services may prioritize cost-effective, simple workflows that minimize administrative overhead. A high-quality template serves both ends of this spectrum through modularity.
For corporate presentations, the focus often shifts to metrics and ROI. Here, the infographic elements serve as containers for dynamic data. Placeholder charts within the template can be replaced with live data links or updated quarterly figures, keeping the presentation relevant. For consumer education, the same assets can be stripped of jargon and repurposed as app store screenshots or waiting room posters. The key is recognizing that the visual language of telemedicine must shift based on the viewer's expertise and intent. Professionals analyzing market trends need comparative matrices, while patients need reassuring, step-by-step guides. Maintaining a library of adaptable vector assets ensures that communication remains effective regardless of the target demographic.
Technical Considerations for Multi-Format Deployment
The practical application of telemedicine infographics extends across print and digital mediums, necessitating careful file format management. While JPG and PNG formats offer universal compatibility for quick sharing and social media, they lack the editability required for serious professional work. Relying exclusively on raster formats locks users into a specific resolution and color profile, leading to degradation when repurposing assets.
A complete asset package containing EPS, AI, SVG, JPG, and PNG addresses the full lifecycle of content creation. Adobe Illustrator (AI) and Encapsulated PostScript (EPS) files preserve layers, gradients, and text editability for deep customization. SVG bridges the gap between design and development, enabling interactive web experiences where users might hover over a service type to reveal additional details. Meanwhile, high-resolution PNGs with transparent backgrounds are indispensable for overlaying graphics onto varied slide decks or website headers. Understanding the appropriate use case for each format prevents quality loss and streamlines the production pipeline. For organizations managing multiple brands or regional variations, this multi-format approach is not a luxury but a logistical necessity.
Enhancing Online Hospital Presentations
Digital health facilities face the unique challenge of conveying physical credibility through virtual interfaces. An online hospital presentation must bridge the psychological distance inherent in remote care. Design elements play a pivotal role in establishing this presence. Using structured layouts and professional color palettes associated with clinical excellence helps transfer the trust traditionally reserved for brick-and-mortar institutions to the digital realm.
Beyond aesthetics, the structural organization of the presentation dictates engagement. Integrating telemedicine service types into a cohesive narrative arc prevents the presentation from becoming a disjointed list of features. The visual hierarchy should lead the audience from problem identification to solution visualization, using the infographic elements as evidence of capability. When stakeholders see a meticulously designed workflow or a clear taxonomy of services, they infer operational competence. Therefore, investing in premium, customizable design templates is ultimately an investment in institutional reputation. The clarity achieved through proper data visualization and workflow mapping directly correlates with stakeholder buy-in, patient adoption rates, and overall program success in the competitive digital health landscape.