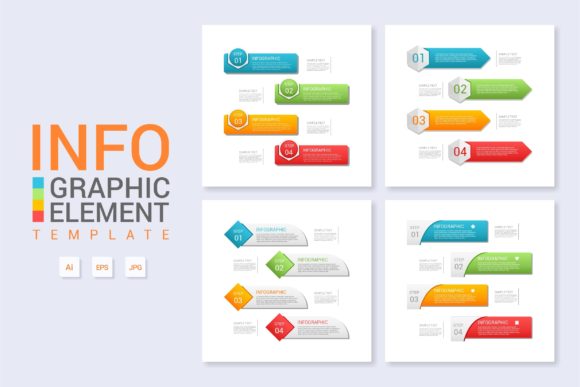
Enhancing Research Communication with a Science Laboratory Infographic Template
The Critical Role of Visual Data in Modern Scientific Dissemination
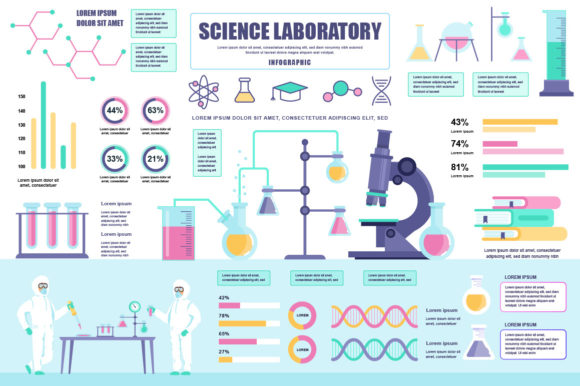
In the contemporary landscape of scientific research, the ability to communicate complex findings clearly is as vital as the discovery process itself. Researchers, educators, and business professionals frequently encounter the challenge of translating dense technical data into accessible narratives. This is where specialized design assets, such as a Science Laboratory Infographic Template, become indispensable tools. Unlike generic presentation slides, these templates are engineered specifically for the nuances of laboratory environments, featuring pre-designed elements like flasks, microscopes, and molecular structures that immediately establish context. The integration of graphic data visualization within these templates allows users to present statistical results, experimental workflows, and historical timelines without requiring advanced graphic design skills.
The demand for high-quality visual communication spans a broad spectrum of users. Academic researchers preparing posters for conferences need to capture attention in crowded halls, while biotech startups pitching to investors must demonstrate rigorous methodology alongside market potential. Educators creating curriculum materials require accurate yet engaging visuals to maintain student interest. By utilizing vector-based illustrations and editable text fields, these templates bridge the gap between raw data and compelling storytelling. They ensure that the visual representation of science maintains professional integrity while enhancing comprehension for diverse audiences, from peer reviewers to general consumers interested in health and technology trends.
Technical Specifications and File Format Versatility
A significant advantage of professional-grade infographic assets lies in their technical flexibility. When acquiring a comprehensive design package, users typically receive a ZIP file containing multiple formats to accommodate various software ecosystems and end-use scenarios. Understanding these specifications is crucial for maximizing the utility of the template across different platforms.
- EPS10 and AI Files: These vector source files are the backbone of the template. Compatible with Adobe Illustrator and other vector editing software, they allow for infinite scaling without pixelation. Users can modify every anchor point, change color palettes to match institutional branding, and rearrange layout components. The EPS10 standard ensures backward compatibility with older versions of vector software, making it a safe choice for collaborative environments where team members may use different tool versions.
- SVG (Scalable Vector Graphics): Essential for digital-first communication, SVG files retain crispness on high-resolution displays and responsive websites. For researchers publishing open-access articles or maintaining lab websites, SVGs provide lightweight, code-editable graphics that improve page load speeds and accessibility compared to raster images.
- PDF: Serving as a universal exchange format, the included PDF preserves the exact layout and typography regardless of the viewer’s operating system. This is particularly useful for sharing drafts with colleagues who do not have design software or for submitting final posters to conference organizers who require print-ready documents.
- JPG and PNG: While non-editable, these raster formats offer immediate usability. High-resolution JPGs are suitable for embedding in Word documents or email updates, while PNGs with transparent backgrounds allow for layering over colored slides or dark-mode presentations. Having these pre-rendered options saves time when minor edits are unnecessary.
Structuring Complex Narratives Through Specialized Layout Elements
The architecture of a Science Laboratory Infographic Template differs fundamentally from standard business infographics. Scientific communication requires specific structural elements that mirror the logical flow of inquiry. Effective templates incorporate dedicated zones for distinct types of information, guiding the viewer through the content intuitively.
Workflow and Process Visualization
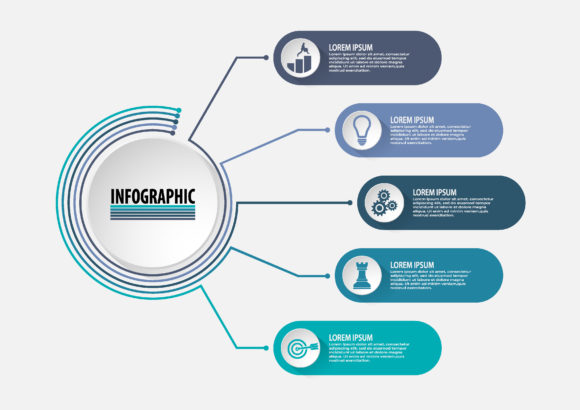
Laboratory protocols often involve multi-step procedures that are difficult to describe textually. Templates featuring workflow diagrams utilize icons of pipettes, centrifuges, and incubators connected by directional arrows to map out experimental processes. This visual shorthand reduces cognitive load, allowing viewers to grasp the methodology at a glance. For instance, a drug development timeline might illustrate the progression from target identification to clinical trials using a horizontal axis marked with milestone icons. This not only organizes information chronologically but also highlights critical decision points and bottlenecks in the research pipeline.
Data Representation and Graphic Visualization
Accurate data visualization is non-negotiable in science. Pre-built chart styles within these templates—such as bar graphs, pie charts, and scatter plots—are designed with clean axes and legible labels suitable for publication. Unlike auto-generated charts from spreadsheet software, these vector graphics can be stylistically unified with the rest of the poster or banner. Users can easily adjust values and labels via editable text layers while maintaining consistent stroke weights and color schemes. This cohesion reinforces the professionalism of the presentation and prevents the jarring visual disconnect that occurs when mixing disparate graphic styles.
Practical Applications Across Professional Domains
The versatility of laboratory-themed infographic assets extends far beyond academic publishing. Various sectors leverage these visual tools to achieve specific communication objectives, demonstrating the broad relevance of well-designed scientific graphics.
Educational Institutions and E-Learning: Teachers and instructional designers use these templates to create visually rich handouts and digital learning modules. A biology lesson on cell division, for example, becomes significantly more effective when accompanied by a colorful, annotated diagram rather than a block of text. The ability to edit text allows educators to tailor vocabulary levels for different grade groups, from elementary introductions to university-level reviews. Furthermore, consistent visual branding across course materials helps students organize their mental models of scientific concepts.
Corporate R&D and Investor Relations: In the private sector, clarity translates to value. Biotechnology firms and pharmaceutical companies utilize science concept banners in annual reports and investor decks to visualize pipeline progress. A well-structured infographic can summarize years of research and millions of dollars in investment into a single, digestible graphic. This aids stakeholders who may lack deep technical expertise in understanding the significance of milestones, regulatory approvals, and future projections. The professional aesthetic signals competence and attention to detail, which are critical factors in building trust with investors and partners.
Public Health and Science Communication: Government agencies and NGOs rely on these templates to disseminate public health information. During health crises or vaccination campaigns, clear infographics explaining transmission vectors or safety protocols can save lives. The inclusion of recognizable medical and laboratory iconography lends authority to the message, while the simplified layout ensures accessibility for populations with varying literacy levels. Editable templates enable rapid response teams to update statistics and guidelines quickly as situations evolve, ensuring the public receives timely and accurate information.
Customization Best Practices for Scientific Integrity
While templates offer convenience, users must exercise diligence to maintain scientific accuracy during customization. The ease of moving vector elements should never compromise the factual representation of data. When modifying charts or diagrams, it is essential to verify that proportions remain truthful; distorting axis scales or exaggerating differences for visual effect undermines credibility. Additionally, users should ensure that selected icons accurately represent the specific equipment or biological entities being discussed. Using a generic beaker icon to represent a specialized bioreactor may be acceptable for a high-level overview but could be misleading in a technical methods section.
Color selection also warrants careful consideration. Beyond aesthetic harmony, colors in scientific graphics often carry semantic meaning. Red might indicate danger or inhibition, while green suggests growth or activation. Adhering to established conventions within specific disciplines helps prevent misinterpretation. Furthermore, designers must consider color blindness accessibility, opting for palettes that remain distinguishable to viewers with visual impairments. Most professional templates include accessible color swatches, but users should always test their final outputs against accessibility standards before publication.
Optimizing Visual Assets for Digital and Print Environments
The dual nature of modern scientific communication requires assets that perform well in both physical and digital realms. A Science Laboratory Infographic Template must be adaptable to these differing constraints. For print applications like conference posters, resolution and color mode are paramount. Working in CMYK color space within the AI or EPS files ensures that vibrant screen colors translate accurately to paper. Users should also pay attention to bleed areas and safe margins to prevent critical information from being trimmed during production.
Conversely, digital optimization focuses on file size and responsiveness. When exporting SVGs or PNGs for web use, minimizing unnecessary anchor points and metadata reduces load times without sacrificing quality. Interactive PDFs can enhance digital posters by embedding hyperlinks to supplementary data, video abstracts, or contact forms. This transforms a static image into a dynamic portal for deeper engagement. Understanding these platform-specific requirements allows creators to extract maximum value from a single template package, ensuring consistent messaging across all touchpoints of their communication strategy.
Ultimately, the effectiveness of any scientific visualization depends on the synergy between form and function. A template provides the structural foundation and aesthetic polish, but the user supplies the intellectual rigor and narrative clarity. By leveraging the comprehensive file formats and specialized design elements available in these resources, professionals across the scientific ecosystem can elevate their communication, ensuring that valuable insights are not just recorded, but truly understood and appreciated by their intended audiences.