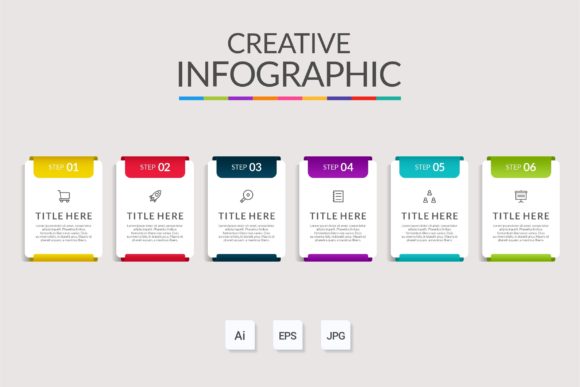
Visualizing Product Narratives: A Structural Guide to Infographic Template Vol.23
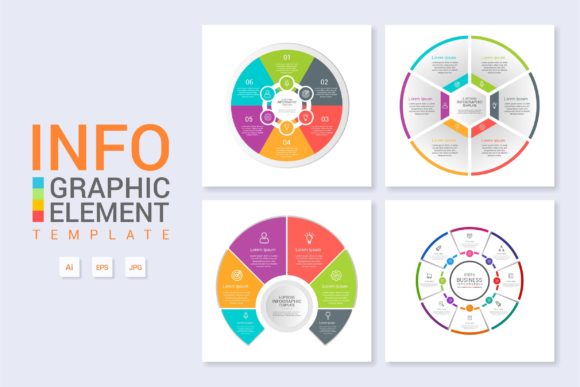
In the current digital ecosystem, the gap between raw data and audience comprehension is bridged by effective visual hierarchy. For professionals ranging from product managers to educators, the challenge often lies not in gathering information, but in structuring it into a digestible format. Infographic Template Vol.23 serves as a specialized framework designed specifically for "About the Product" narratives, offering a pre-engineered layout that transforms complex specifications into clear, compelling visual stories. This template moves beyond simple decoration, functioning as a strategic tool for workflow layout, banner design, and technical diagramming across web and print media.
The Architecture of Product-Centric Visuals
Unlike generic infographic designs that prioritize aesthetic novelty over function, this specific volume focuses on the structural requirements of product explanation. When communicating value propositions or technical workflows, the arrangement of elements dictates how quickly a user processes information. The template utilizes a modular grid system that supports both linear storytelling and non-linear data exploration.
This architectural approach is critical for diverse audiences. A business owner presenting to stakeholders requires a different visual flow than a researcher publishing findings or a hobbyist creating a tutorial. By providing a foundational structure that is inherently organized, the template allows creators to bypass the initial paralysis of blank-canvas design. The layout anticipates common product communication needs, such as feature highlighting, process breakdowns, and comparative analysis, ensuring that the final output remains focused on clarity rather than stylistic experimentation.
Technical Flexibility Through Layered Organization
The utility of any design asset is defined by its editability. A major friction point in professional design workflows is navigating poorly constructed source files where elements are merged, rasterized, or unnamed. Infographic Template Vol.23 addresses this through rigorous file hygiene. Both the Main AI (Adobe Illustrator) and Main EPS files are meticulously layered and organized.
This level of organization offers tangible practical advantages:
- Non-Destructive Editing: Because every element resides on its own designated layer, users can modify colors, shapes, and positions without accidentally altering adjacent components. This isolation is essential when adapting a template for different brand guidelines.
- Scalability Without Degradation: The vector-based nature of the AI and EPS formats ensures that whether the graphic is used as a small web icon or a large-format banner, edges remain crisp. There is no pixelation, making it suitable for high-resolution print materials and retina displays alike.
- Efficient Collaboration: In agency or team environments, organized layers reduce onboarding time for new designers. A colleague can open the file and immediately understand the structure without needing a verbal walkthrough, streamlining collaborative projects.
Typography and Text Modification
Text handling is often the most time-consuming aspect of customizing templates. This resource simplifies the process by utilizing free fonts, eliminating licensing hurdles and compatibility issues. The instruction to "simply change the text" reflects a design philosophy where typography is treated as a flexible variable rather than a fixed artistic element. Placeholder text is structured to demonstrate optimal line lengths and hierarchy, guiding the user toward readable copy placement. When replacing content, the underlying typographic styles maintain visual consistency, ensuring that even significant textual revisions do not break the overall design balance.
Diverse Applications Across Professional Domains
The versatility of this template extends far beyond traditional marketing collateral. Its structural neutrality allows it to serve as a functional canvas for various disciplines.
Workflow and Process Diagramming
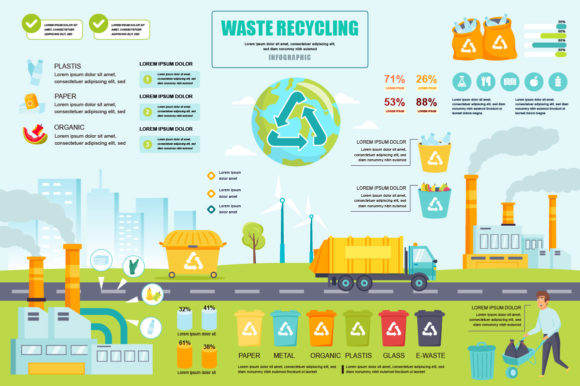
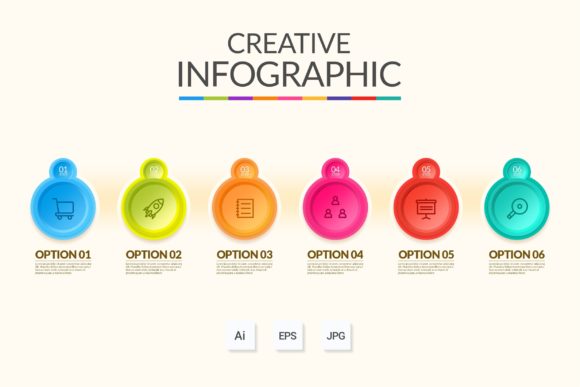
For operations managers and UX designers, visualizing workflows is a daily necessity. The template’s layout supports sequential diagramming, making it ideal for illustrating user journeys, manufacturing processes, or software development lifecycles. The clean lines and distinct separation of elements prevent visual clutter, which is crucial when mapping complex systems. By using this template, professionals can standardize their internal documentation, creating a cohesive visual language that improves team alignment and reduces miscommunication.
Educational and Research Communication
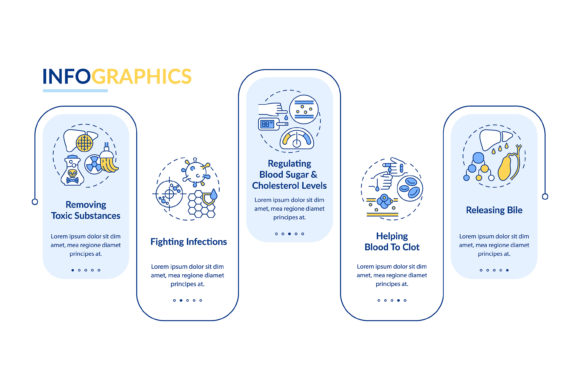
Educators and researchers often struggle to make dense information accessible. Whether explaining a biological mechanism, a historical timeline, or a statistical trend, the "About the Product" framework translates effectively to "About the Concept." The template provides a scaffold for breaking down academic or technical subjects into bite-sized visual chunks. This aids in retention and engagement, particularly for visual learners. Researchers can use the banner and diagram capabilities to create conference posters or supplementary materials for publications that meet professional standards without requiring extensive graphic design training.
Web Design and Digital Integration
In web design, consistency and load performance are paramount. Because the template is vector-based, assets exported from it are lightweight compared to raster images. Web designers can utilize the template to create hero banners, feature sections, or interactive diagram bases. The organized layer structure allows for easy export of individual components as SVGs, facilitating modern responsive design practices. Furthermore, the aesthetic neutrality of the template ensures it integrates smoothly with existing website themes, acting as a complementary element rather than a distracting outlier.
Strategic Considerations for Implementation
While Infographic Template Vol.23 provides a robust foundation, maximizing its effectiveness requires strategic input from the user. A template is a vessel; the quality of the output depends on the substance poured into it.
Content Hierarchy and Cognitive Load
Before opening the AI or EPS file, creators should audit their content. Not all information holds equal weight. Identify the primary message, secondary supporting points, and tertiary details. Map these to the template’s visual hierarchy. Overloading the design with excessive text or too many data points defeats the purpose of an infographic. Use the template’s whitespace intentionally to guide the viewer’s eye and reduce cognitive load. If a section feels cramped, it is often a sign that the content needs editing, not that the layout needs expansion.
Brand Alignment and Customization
While the template includes free fonts and a cohesive color scheme, it should be adapted to reflect specific brand identities or project tones. This goes beyond simply swapping logos. Consider adjusting stroke weights, corner radii, and color saturation to match organizational guidelines. However, maintain the core structural integrity of the template. Drastic alterations to the grid or spacing can undermine the usability features that make the template valuable. The goal is to make the design feel bespoke while retaining the efficiency of the pre-built framework.
Accessibility and Inclusivity
Visual communication must be inclusive. When modifying text and colors within the template, ensure sufficient contrast ratios for readability. Avoid relying solely on color to convey meaning; use icons, labels, and patterns as redundant cues. Since the template is layered, adding alt-text descriptions for web exports or tactile elements for print is straightforward. Prioritizing accessibility expands the reach of the content and demonstrates professional responsibility, aligning with modern E-E-A-T principles that value trustworthiness and user experience.
Optimizing the Design Workflow
Integrating this template into a production pipeline can significantly reduce turnaround times. To achieve this, establish a standardized customization protocol. Begin by duplicating the master file to preserve the original asset. Create a style guide specific to the project before making edits, defining which layers correspond to which content types. Utilize the organized layer groups to toggle visibility during the review process, allowing stakeholders to focus on specific sections without distraction.
For teams producing multiple infographics, consider creating a localized library of modified components based on the template. If a specific chart style or header treatment works well, save it as a reusable symbol or graphic style within Illustrator. This leverages the template’s modularity to build a proprietary design system over time, compounding efficiency gains with each subsequent project.
Ultimately, Infographic Template Vol.23 represents more than a collection of vector shapes; it is a methodology for visual thinking. By providing a structured, editable, and professionally organized environment, it empowers creators across all skill levels to produce high-impact visuals. Whether the goal is to sell a product, teach a concept, or map a workflow, the template removes technical barriers, allowing the focus to remain where it belongs: on clear, effective communication. The combination of accessible file formats, logical organization, and versatile application makes it an indispensable asset in the modern creator’s toolkit, bridging the divide between complex information and meaningful understanding.