Personal Branding Components: Selecting Visual Assets That Actually Work
Building a recognizable professional identity requires more than just a polished headshot or a clever tagline. It demands a cohesive visual system that communicates your value proposition at a glance. This is where Personal Branding Components become essential. These are the foundational design elements—infographics, process charts, icon sets, and layout templates—that transform abstract career concepts into tangible, digestible visuals. For bloggers, entrepreneurs, educators, and freelancers, these components serve as the bridge between complex expertise and audience understanding.
However, many professionals approach these assets with the wrong mindset. They treat them as mere decoration rather than strategic communication tools. The result is often a disjointed presentation that looks generic or, worse, confuses the very people you are trying to impress. To leverage personal branding vectors and infographic templates effectively, you must understand not just what they are, but how to evaluate, customize, and implement them without falling into common design traps.
The Strategic Role of Process Visualization
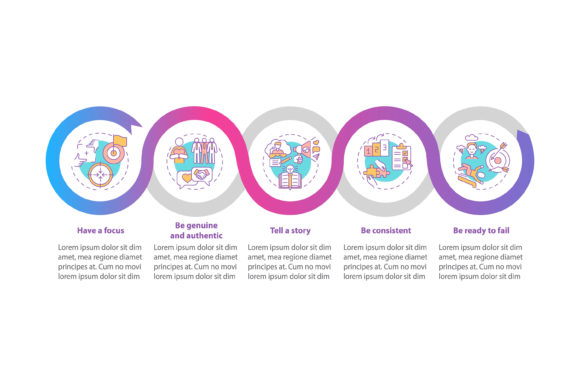
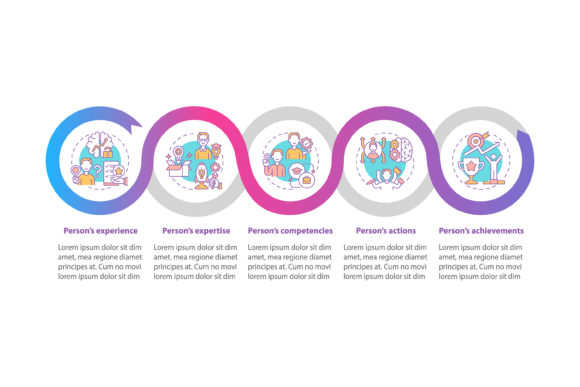
When potential clients or employers evaluate your services, they are rarely looking for a wall of text. They want to understand your methodology. A well-designed process timeline chart or a 5-step workflow layout does this heavy lifting instantly. These specific personal branding components visualize your unique approach, whether it is a content creation cycle, a consulting framework, or an educational curriculum.
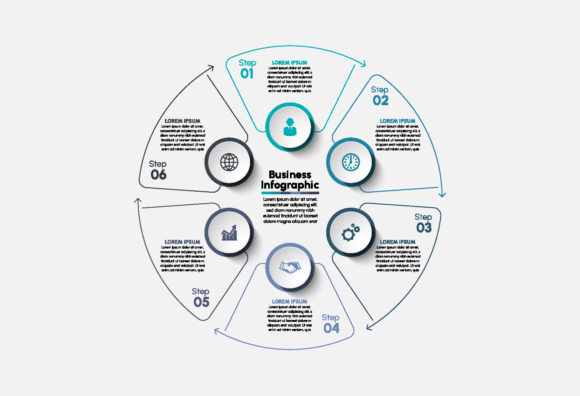
The mistake many beginners make is selecting templates based solely on aesthetic appeal rather than structural relevance. A beautiful circular diagram might look modern, but if your actual service delivery is linear, using that template creates cognitive dissonance. Your audience will subconsciously sense the mismatch between what you say and what you show. Before downloading any asset, map out your actual process first. Only then should you seek a template that mirrors your reality. Authenticity in data visualization builds trust; forcing your unique workflow into a trendy but ill-fitting shape undermines it.
Evaluating File Formats for Long-Term Usability
One of the most frequent oversights occurs during the acquisition phase. Users often grab the first available JPG or PNG because it is immediately viewable, neglecting the source files necessary for future adaptation. While raster formats like JPG and PNG are perfect for final web publication, they are virtually useless for editing. If you need to change a color to match your new brand palette or update a statistic next year, a flattened image forces you to start from scratch.
To ensure efficiency and cost-effectiveness, always verify that the package includes scalable vector formats such as EPS, SVG, or AI. Vector graphics maintain crisp edges at any size, making them ideal for everything from business cards to large-format presentation slides. Furthermore, having the editable source file allows you to maintain consistency across different platforms. A personal branding component that cannot be modified is a temporary solution; a vector template is a long-term asset. Always prioritize versatility over immediate convenience.
Avoiding the "Generic Template" Trap
There is a fine line between using a helpful template and presenting a cookie-cutter brand. Personal branding components vector infographic templates are designed to be starting points, not finished products. A common error is leaving placeholder text, default colors, or stock icons unchanged. Audiences are increasingly visually literate; they can spot uncustomized assets instantly, which signals a lack of effort or attention to detail.
To correct this, apply the "30% Rule." Aim to alter at least 30% of the original design elements. Swap out generic linear icons for ones that specifically represent your industry niche. Adjust the typography to match your existing brand guidelines. Modify the color hierarchy to guide the viewer’s eye toward the most critical information in your 5-step data visualization. Customization is what transforms a purchased resource into a proprietary brand asset. It demonstrates that you have invested thought into how your message is received, distinguishing you from competitors who rely on out-of-the-box defaults.
Data Visualization Integrity and Clarity
In the pursuit of visual impact, some creators sacrifice accuracy for style. This is particularly dangerous when using data visualization components within personal branding. Exaggerating growth curves in a timeline chart or misrepresenting proportions in a comparison graphic may grab attention momentarily, but it erodes credibility permanently. Professionals aged 20–50, especially those in B2B sectors, scrutinize these details.
Ensure that your visual metaphors align with the data's truth. If your growth was steady, do not use an exponential arrow. If your five steps are equally weighted, do not make step three visually dominant unless there is a strategic reason to emphasize it. Good design clarifies; bad design obscures. When selecting workflow layouts, ask yourself if the graphic makes the information easier to understand or merely prettier to look at. If the answer is the latter, reconsider the choice. Effective personal branding components enhance comprehension, reducing the cognitive load on your audience rather than adding to it.
Technical Compatibility and Workflow Integration
Before committing to a set of personal branding components, verify technical compatibility with your current ecosystem. An intricate AI file is worthless if you only have access to basic online design tools. Conversely, a simple PNG might frustrate a designer working in Adobe Illustrator who needs layered paths. Understanding your own workflow limitations prevents wasted spend and abandoned projects.
- For Non-Designers: Look for templates that offer both SVG (for web) and editable PDF or PPTX versions alongside standard vector files. This ensures you can make minor text edits without specialized software.
- For Designers: Prioritize organized layers, global color swatches, and smart objects in AI/EPS files. Clean file structure saves hours of cleanup time.
- For Web Publishers: Ensure SVGs are optimized and code-clean. Bloated vector files can slow down page load times, negatively impacting SEO and user experience.
Additionally, consider the context of use. A detailed process timeline chart might work beautifully in a slide deck but fail miserably as an Instagram thumbnail. Test your chosen components at various sizes before finalizing your brand kit. Versatility is a hallmark of high-quality personal branding assets.
Maintaining Consistency Across Touchpoints
Finally, remember that personal branding components do not exist in isolation. They must converse with your other visual elements. A frequent misstep is mixing disparate illustration styles—combining hand-drawn sketches with rigid geometric vectors, or pairing 3D renders with flat linear icons. This stylistic clash creates visual noise that distracts from your message.
Create a mini style guide specifically for your infographic and chart usage. Define which icon set you will use, establish a consistent stroke weight, and lock in a secondary color palette dedicated to data visualization. When your blogger career presentation design elements share a unified visual language, your brand feels professional and established. Consistency breeds familiarity, and familiarity breeds trust. By treating these components as part of a holistic system rather than isolated decorations, you build a personal brand that resonates clearly and endures over time.