Info Analysis UI Elements Kit: Practical Data Visualization for Real-World Projects
Turning raw numbers into a compelling visual story is one of the most common bottlenecks in modern digital design. Whether you are building a fintech app, designing an educational dashboard, or creating a pitch deck for investors, the challenge remains the same: how do you present complex information without overwhelming your audience? This is where the Info Analysis UI Elements Kit becomes an essential resource. It is not merely a collection of pretty graphics; it is a functional toolkit designed to bridge the gap between heavy data analytics and clean, user-friendly interface design.
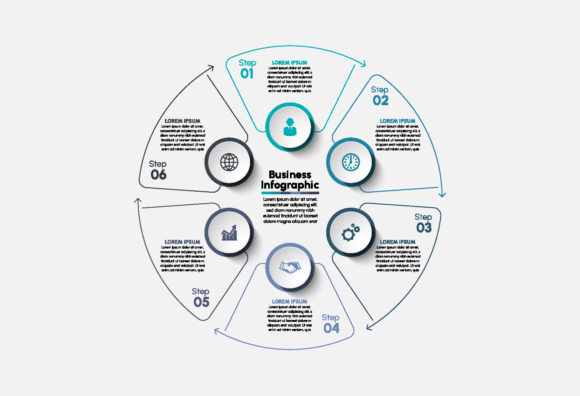
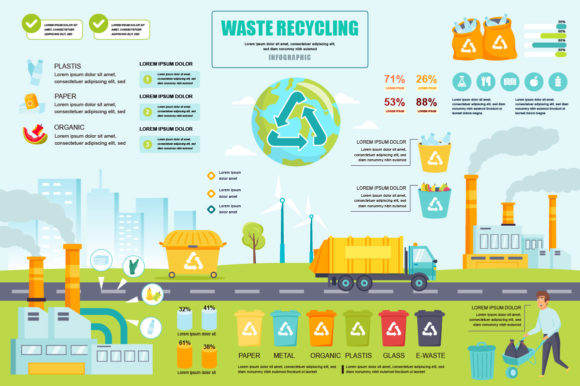
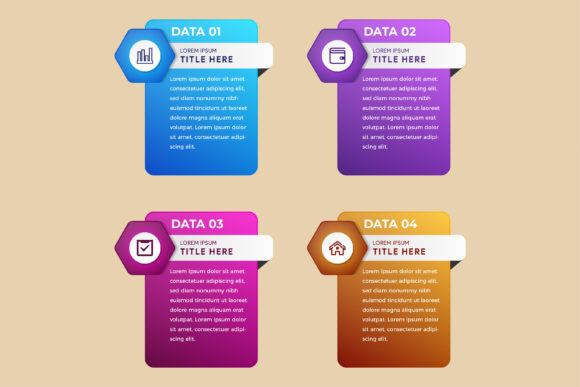
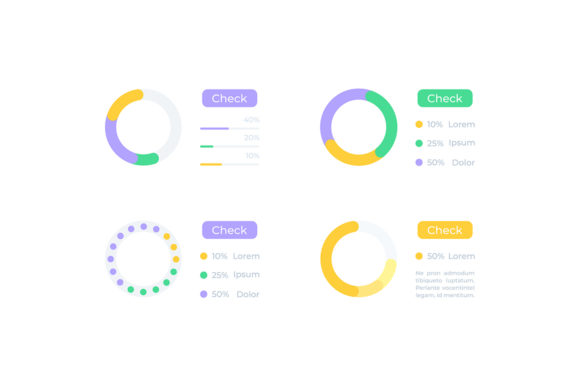
The kit provides a comprehensive suite of pre-designed components specifically tailored for information-heavy environments. It includes infocharts with figures, isolated vector icons, bar graphs, and complete dashboard templates. Crucially, these assets are optimized for mobile applications with light theme interfaces, addressing a specific need in today’s mobile-first market. Because the ZIP file contains editable source files like EPS, AI, and SVG alongside ready-to-use PNG and JPG formats, it serves both designers who need to customize every pixel and marketers who simply need to drop a high-quality graphic into a presentation immediately.
Accelerating Mobile App Development and Prototyping
For app developers and UI/UX designers working on tight deadlines, the initial phase of designing data screens can be deceptively time-consuming. Creating consistent chart styles, selecting appropriate iconography, and ensuring legibility on small screens often takes days of iteration. The Info Analysis UI Elements Kit solves this by providing a cohesive system right out of the box.
Consider a freelance developer building a personal finance tracker. Instead of drawing thirty different variations of spending category icons or struggling to align bar chart axes, they can utilize the kit’s pre-made widgets. This allows them to move straight to user testing and functionality validation. The light theme interface included in the kit is particularly valuable here, as light modes remain the standard for readability in productivity and financial apps. By using these standardized elements, the developer ensures that the app looks professional from day one, which is critical when seeking early beta testers or showcasing work in a portfolio.
Elevating Business Presentations and Stakeholder Reports
Entrepreneurs and small business owners frequently face the challenge of communicating performance metrics to stakeholders who may not have technical backgrounds. A spreadsheet full of rows and columns rarely inspires confidence or clarity during a quarterly review. The infographic templates and dashboard layouts within this kit allow non-designers to transform dry reports into engaging visual narratives.
Because the kit includes high-resolution JPG and PNG files, a marketing manager can quickly insert a polished "User Growth" infochart into a slide deck without needing to open Adobe Illustrator. Conversely, if the business decides to rebrand next month, the inclusion of AI and EPS files means the same charts can be recolored and adjusted to match new brand guidelines perfectly. This flexibility makes the kit a long-term asset for business communications rather than a single-use purchase. It helps professionals focus on the insights behind the data rather than the mechanics of drawing the chart itself.
Enhancing Educational Content and E-Learning Platforms
Educators and content creators in the e-learning space understand that visual aids significantly improve retention rates. However, creating custom diagrams for every lesson is resource-prohibitive. The Info Analysis UI Elements Kit offers a scalable solution for course creators who need to explain statistical concepts, research methodologies, or market trends.
An online instructor teaching data literacy can use the isolated vector icons to create interactive flashcards or module headers. The dashboard templates can serve as background frameworks for video lessons, giving the course a consistent, high-production value look. Since the assets are vector-based, they remain crisp whether viewed on a student’s smartphone or projected onto a classroom screen. This consistency helps build a recognizable brand identity for the educator while making complex subjects more approachable for learners.
Streamlining Content Marketing and Blog Visuals
Bloggers and publishers know that articles featuring original data visualization receive higher engagement and backlinks. Yet, hiring a custom illustrator for every blog post is rarely feasible. This kit acts as an on-demand design department for content teams. When writing about industry trends, a blogger can assemble a custom infographic using the kit’s bar charts and icons in minutes.
The practical benefit here extends beyond aesthetics. Search engines and social media algorithms favor content that keeps users on the page longer. A well-structured infochart breaks up walls of text and encourages scrolling. Furthermore, because the kit covers a wide range of analytical visuals, content creators can maintain a uniform visual style across hundreds of posts, reinforcing site authority and trustworthiness with readers.
Critical Considerations Before Implementation
While the Info Analysis UI Elements Kit is versatile, maximizing its value requires some forethought. Users should first assess their output requirements. If you intend to modify colors, stroke weights, or structural layouts, you must have access to vector editing software like Adobe Illustrator or Affinity Designer to utilize the AI and EPS files. Relying solely on the raster images (JPG/PNG) will limit your ability to adapt the kit to specific brand identities.
It is also important to consider the context of the "light theme." While excellent for most corporate, educational, and utility applications, these assets may require significant modification if your project demands a dark mode aesthetic. Designers should plan for this adaptation time or verify that the vector lines are thick enough to remain visible when inverted against dark backgrounds.
Data accuracy is another consideration. These templates are structural guides, not automated data tools. Users must ensure that when they populate these charts with real-world figures, the visual representation remains truthful. Stretching a bar chart disproportionately to exaggerate growth undermines the professional credibility the kit is meant to enhance. Always treat these elements as containers for accurate information, not just decoration.
Choosing the Right Format for Your Workflow
The multi-format nature of this ZIP file is one of its strongest practical features, but choosing the wrong format can slow you down. Understanding when to use each file type is key to efficiency:
- SVG: Best for web development and responsive mobile apps. These scale infinitely without losing quality and can be styled with CSS, making them ideal for live dashboards.
- AI/EPS: Essential for print materials, large-format displays, or deep customization. Use these when you need to change the fundamental shape of a widget or merge multiple elements into a new composite graphic.
- PNG: Ideal for presentations, documents, and quick mockups where transparency is needed but editing is not. These are ready for immediate drag-and-drop usage.
- JPG: Suitable for social media posts or email newsletters where file size matters more than transparency or scalability.
By matching the file format to the specific task at hand, users can avoid common workflow friction points. A web developer shouldn't be converting PNGs to SVGs manually, and a presenter shouldn't be trying to figure out vector layers five minutes before a meeting. The kit supports all these workflows natively, provided the user selects the appropriate asset from the start.
Real Outcomes Over Generic Features
Ultimately, the value of the Info Analysis UI Elements Kit lies in the problems it eliminates. It removes the intimidation factor of data visualization for non-designers and removes the repetitive grunt work for professional designers. For the entrepreneur, it translates to faster investor buy-in through clearer communication. For the educator, it means more engaging lessons with less prep time. For the app developer, it results in a more polished MVP that stands out in a crowded marketplace.
In a digital landscape saturated with generic stock photos and clip art, having access to specialized, structured, and editable analytical UI components provides a distinct competitive advantage. It signals to your audience that you care about clarity, precision, and user experience. Whether you are analyzing sales figures, teaching statistics, or tracking personal habits, this kit provides the visual vocabulary necessary to make that data meaningful, accessible, and visually consistent across every platform you use.